In an era where mining operations increasingly rely on data analytics, it's essential to adopt strategies that provide actionable insights. Traditional reactive approaches are being replaced by proactive, data-driven decisions, facilitated by advancements in analytics.
While Tier 1 mining companies like BHP and Rio Tinto are transitioning to predictive analytics and machine learning, smaller operations still rely on outdated methods. VoarTechs aims to democratize access to advanced analytics, enabling all miners to optimize operations and increase efficiency through a structured three-step framework: Collect, Create, and Communicate.
Collect
The 'Collect' step involves centralizing data from various source systems into a unified data warehouse. This consolidation is crucial for building a robust analytics foundation, allowing for easier access and more complex data operations, including predictive modeling.
For example, integrating actual operational data from a Fleet Management System (FMS) with budget figures from an ERP system like Pronto into a central data warehouse, such as Snowflake, simplifies the creation of comprehensive dashboards.
What Are ELT Pipelines?
ELT (Extract, Load, Transform) pipelines facilitate the transfer of data from source systems to a data warehouse. The primary goal is efficient data movement, with optional transformations to clean and prepare data for analysis.
Recommended ELT Pipeline
For reliable, enterprise-grade data integration, VoarTechs recommends Fivetran. It offers robust support for automated data synchronization and is user-friendly for setting up and managing data flows. Learn more about setting up Fivetran pipelines on their website.
Once centralized, the next step is creating a semantic model within a powerful analytics tool like Power BI.
Create
'Create' involves building semantic models to translate raw data into business insights. Semantic models contextualize data, making it user-friendly and tailored to specific operational needs, such as calculating availability and utilization percentages.
For instance, you might integrate data from 'Machine Usage' and 'Down Events' tables to create models that can trace specific operational metrics like downtime reasons per operator, directly impacting strategic decisions.
Communicate
The 'Communicate' step focuses on the effective presentation of insights through user-friendly dashboards that facilitate quick decision-making. Integrating interactive elements such as filters and slicers enables deeper analysis and discovery, allowing stakeholders to probe into data and derive actionable insights.
In Practice:
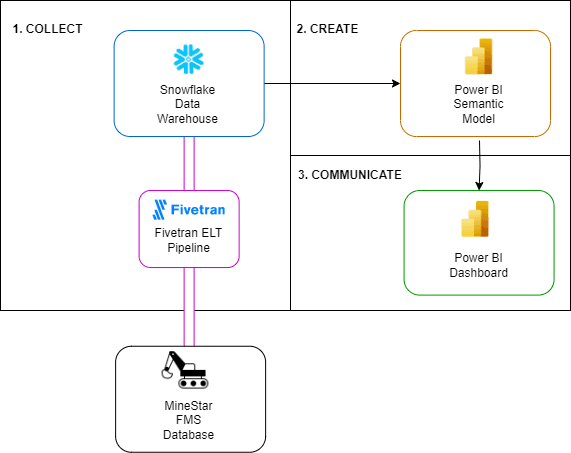
To illustrate a practical application of our framework, consider the below basic architecture for achieving data-driven insights at a surface mining site using CAT's MineStar Fleet Management System (FMS).

The first step - '1.Collect' - involves constructing an ELT pipeline that transfers data from MineStar to a Snowflake data warehouse. You would configure this pipeline to synchronize only the relevant tables, allowing for near real-time data integration.
Once the data is flowing smoothly from the source system to the data warehouse, you can begin to construct your semantic model in Power BI - '2. Create'.This phase is crucial and complex, requiring a deep understanding of both business requirements and the specific details of MineStar's database schema. The objective is to transform, clean, and adjust the raw data to align with key operational metrics such as tonnes per hour, availability, and utilization. After validating that your model accurately reflects these metrics, you deploy it within the Power BI service, making it accessible to other business units.
The final stage involves creating the actual visualizations in a Power BI dashboard - '3. Communicate'. This process requires thoughtful consideration of how best to present the metrics. Decisions about whether to use charts, tables, or custom visuals play a critical role in how effectively information is communicated. Additionally, you must integrate interactive features such as filters and slicers to allow end-users to explore the data further and make informed decisions based on their specific needs. This stage is about ensuring that the dashboard is not only informative but also user-friendly and tailored to the audience's requirements.
Conclusion:.
By following the 3 C Framework—Collect, Create, and Communicate—mining operations can transition from traditional data handling to a more insightful, data-driven approach. This methodical progression from data collection and integration, through semantic model creation, to effective communication of insights via interactive dashboards, ensures that every level of the operation gains the clarity and detail needed to optimize performance. Ultimately, this framework not only streamlines data management but also enhances the decision-making process, enabling mines to respond more adeptly to both challenges and opportunities.

